The Weather and What it Means at SiteMarker

Rain happens. Sometimes it’s just a nuisance. Other times, it halts entire projects. In stormwater compliance, even a tenth of an inch can trigger inspections, reporting, or regulatory headaches.
That’s why we’re introducing the Weather Dashboard, powered by Precip.ai. This new feature gives your team field-first access to accurate, real-time rainfall data—right inside SiteMarker. Even better: it’s fully integrated into your SWPPP reports, eliminating guesswork and manual entry.
Now, when the skies open, you’re already one step ahead.
Who Benefits from This?
The Weather Dashboard is built for everyone who touches a project:
- SWPPP Inspectors
Check rainfall totals before heading out—skip unnecessary site visits or jump on urgent ones. - Civil Engineers & Environmental Managers
Automatically add rainfall logs to reports and keep compliance on track. - Contractors & Developers
Confirm weather-related delays and protect your projects when questions arise.
Why It Matters
No more juggling NOAA websites, weather apps, or spreadsheets. With SiteMarker, you get:
- Rainfall data that’s tied to your actual job sites.
- Reports that already include what regulators need—without extra steps.
- Logs that are accurate, defensible, and ready when you need them.
How You’ll Use It
Here’s how simple it is:
- Open your project in SiteMarker (web or mobile).
- Tap Weather to see current rain totals and forecasts.
- Watch rainfall data flow automatically into your SWPPP reports.
- Turn on Autogenerated Rainfall Log to keep a live, editable CSV updated in your project files.
It’s not just about numbers—it’s about knowing when to act.
Related Articles
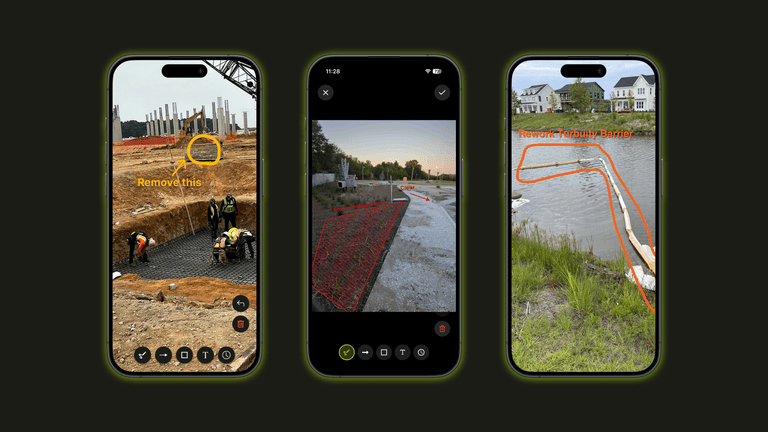
Introducing Photo Markup: Turn Site Photos Into Clear Communication
With Photo Markup, documentation becomes faster and clearer. Instead of taking photos, writing explanations, clarifying later, you simply take a photo, mark it up and move on. The explanation happens in real time, while the details are still fresh.

Introducing Nearmap in SiteMarker
See What’s Really on the Ground